
Reports Corner: Acumatica 2020 R1 New Features
- 23/04/2020
- Accounting Software, Acumatica, New Features, Reports Corner, UK
• Pivot table; showing percentage of totals • Pivot table; count of unique values • Dashboards; data refreshing intervals • Enhancements to the management of the Automation Schedule History • Show deleted records in inquiries •
In Acumatica Cloud ERP the functionality and features of generic inquiries and dashboards are continually improved, modified and enhanced through ongoing software updates and enhancements.
In this post of ‘Reports Corner’ our reporting expert, Sue MacKeown, shows the latest updates from release 2020 R1:
1. Pivot tables – showing percentage of totals
This update really enhances ways in which you can view your data. I’ve given a few examples below of how this might be used.
In the first example, the percentage of profit for each inventory item by the total profit for the month, can now be shown on the pivot table using the ‘percentage of column’ feature;

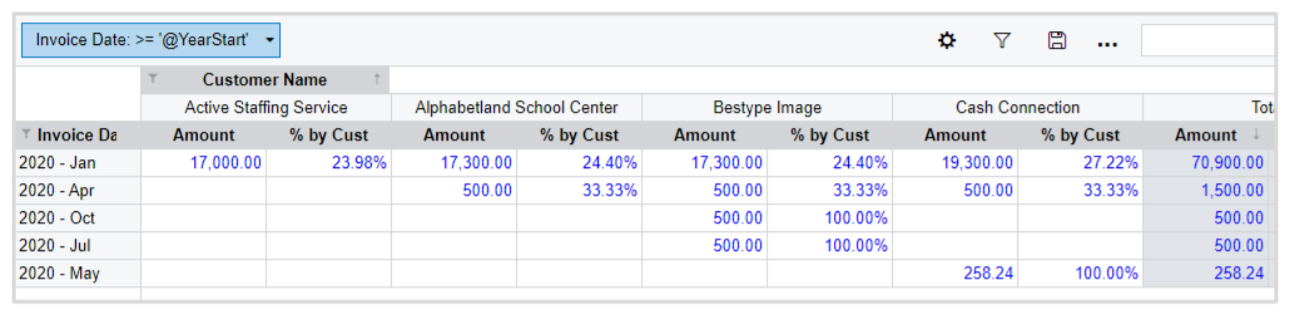
Using the percentage of a row total in a pivot table, the next example shows the percentage of a customer’s invoiced amount by
the total amount invoiced, for the month;
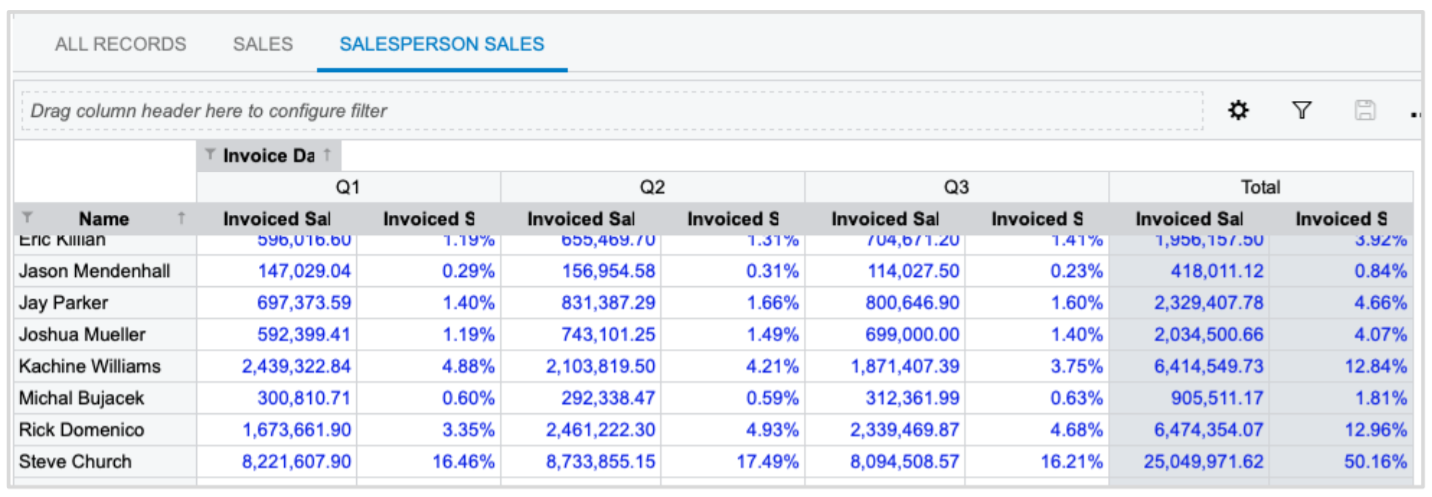
In this example, the percentage of the salesperson’s invoiced sales per quarter by the total sales for the year is shown on the pivot table. In addition to this, the percentage of the salesperson’s annual sales by the total sales is shown in the total columns of the pivot;
2. Pivot tables – count of unique values
Take the opportunity to view unique counts of various accounts, sub accounts and classes. Use the data to drill down and understand more about your business.
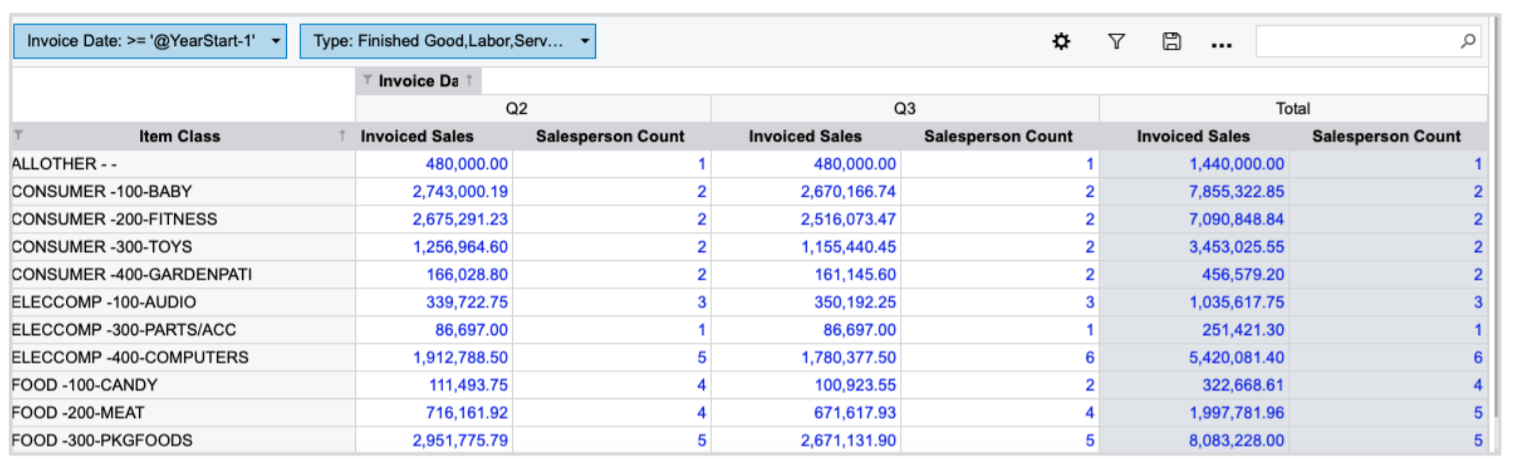
Example;
This pivot table shows invoiced sales amount per item class and the distinct count of salespersons. The distinct count of salespersons indicates the number of salespersons who had made a sale for that item class. The data relating to a selected item class (the salespersons and the invoiced sales) can then be displayed on the drill down screen from the pivot table.
3. Dashboards – showing data refreshing intervals
The interval for refreshing data can be modified to reduce the time taken for data to be loaded on widgets. The amount of time that
has passed since the last update of the data is displayed on the widget. The refresh data interval options are measured in minutes, hours, days, a week or ‘always’.

4. Enhancements to the Management of the Automation Schedule History
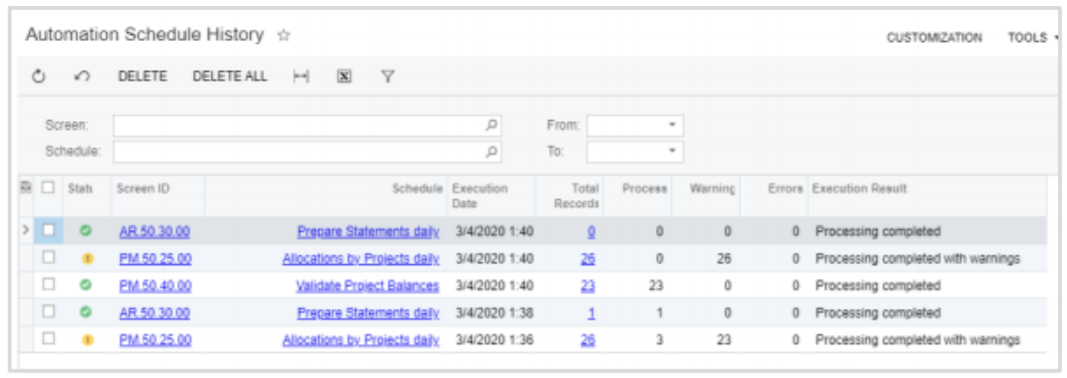
System administrators can view records of the schedule executions, review any errors, and delete selected records.
To view details click the link in the Total Records column of the selected row. The system opens the Processing Results dialog box with the detailed information.
The View History button, which opens the Automation Schedule History (SM205035) form, has been added to the Automation Schedules (SM205020) and Automation Schedule Statuses (SM205030) forms.
5. Showing deleted records on generic inquiries
Deleted records can now be included in the table of any generic inquiry. Useful for tracking change and understanding what’s happening in your business.
The goal of these updates and enhancements is to provide increasingly efficient and flexible ways in which information can be accessed and presented, all of which are applicable to individual businesses, functions and roles. If there is something you would like to see as a new feature in Acumatica please contact me and we will be sure to put your feature request forward.
Tascoli are dedicated to bring you the latest information about ERP and how it can benefit your business. We implement, integrate and offer on going support to Acumatica ERP UK, Sage 300 UK and QuickBooks Enterprise Solutions UK (now discontinued).
About us
Tascoli are an ERP and accounting software services company in the UK and Europe. Our passion is your business efficiency.
Request a Demo
Contact us to receive a demonstration and quote for replacing you ERP system.
More from our blog
See all posts


